Primary School Maths Results Infograph
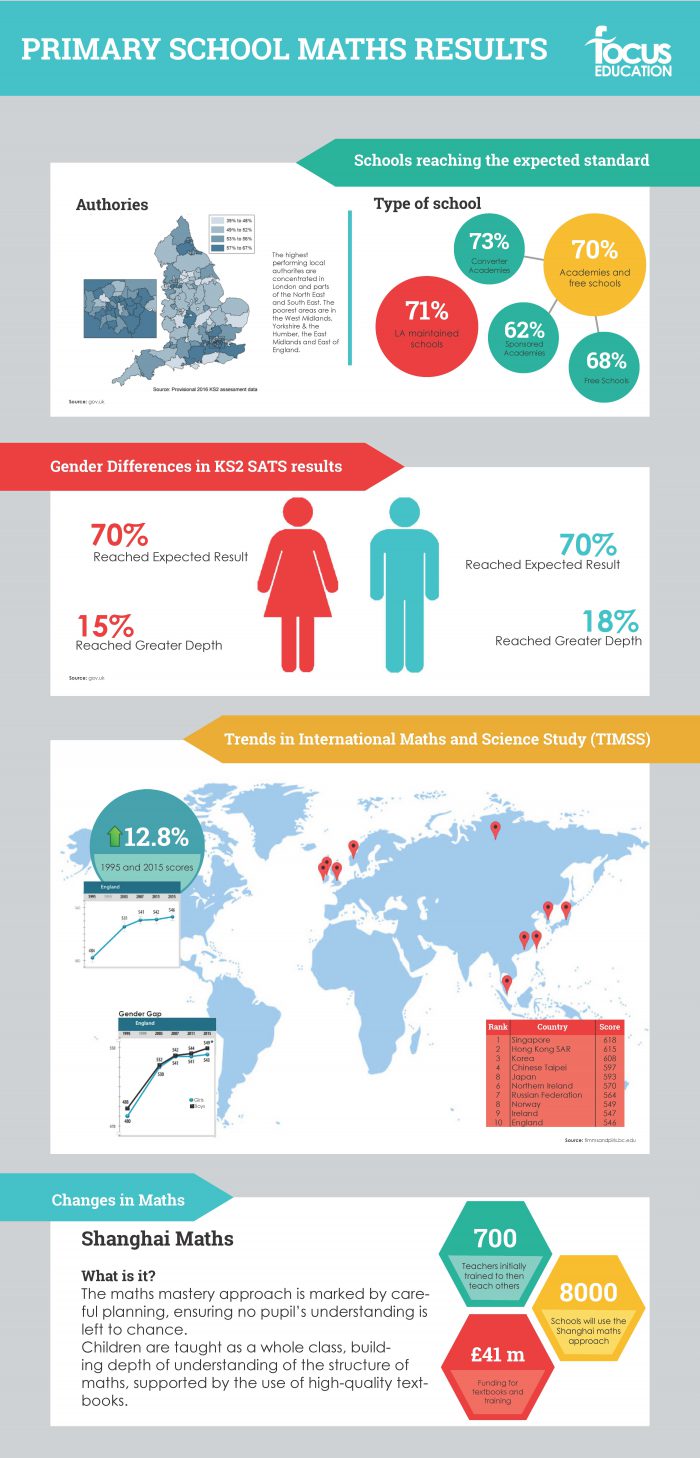
A maths infograph, looking at the expected standards, gender differences in KS2 SATs results, trends in international maths and changes in maths results in the maths curriculum in primary schools.
Schools Reaching the Expected Standard
This infograph shows the highest performing local authorities are concentrated in London and in parts of the North East and South East. It also shows the percentage of ‘type of schools’ in the country that reached the expected standard. LA maintained schools reached the expected standard by 1 percent more than academies and free schools. It will be very interesting to see if this changes within the next few years.
Gender Differences
The graph also shows gender differences in KS2 SATs results. It reflects that 70% of girls and boys across the country reached their expected results, but only 15% of girls reached greater depth whereas 18% of boys reached greater depth.
International Trends
The international trends section on the infograph shows that England ranks 10th in TIMSS and Singapore came first followed closely by Hong Kong. the gender gap for TIMSS shows that there is still a slight gender gap with boys performing slightly higher than girls. The TIMSS study is done every 4 years, and the next study should take place in 2019.
The final section of this maths infograph looks at the ‘Shanghai Maths Approach’. Studies have found that 8000 schools are now using the Shanghai Maths Approach.
Related maths products from Focus Education:
Vicky is the Marketing Executive at Focus Education.


